
In the days after the midterm election, stock markets moved up and down sharply, with technology and AI-related stocks leading the swings. One of the biggest concerns for financial markets right now is what happens to the construction of data centers going forward.
Data centers are facilities that house the computer servers powering AI applications, and building them has been a major driver of economic growth and corporate earnings. The midterm election results, including specific ballot measures, suggest that many voters want to slow or restrict this construction at multiple levels of government.
These developments add pressure on technology stocks, which have contributed meaningfully to investment returns in recent years. However, questions remain about whether stock prices are too high relative to earnings, how interest rates affect these companies, and whether massive spending on AI infrastructure will ultimately pay off. At the same time, short-term swings in these parts of the market are normal, and returns have been strong over longer periods. So what do the election results mean for investors, and how can they keep a broader perspective?
Voters largely sought to restrict data centers
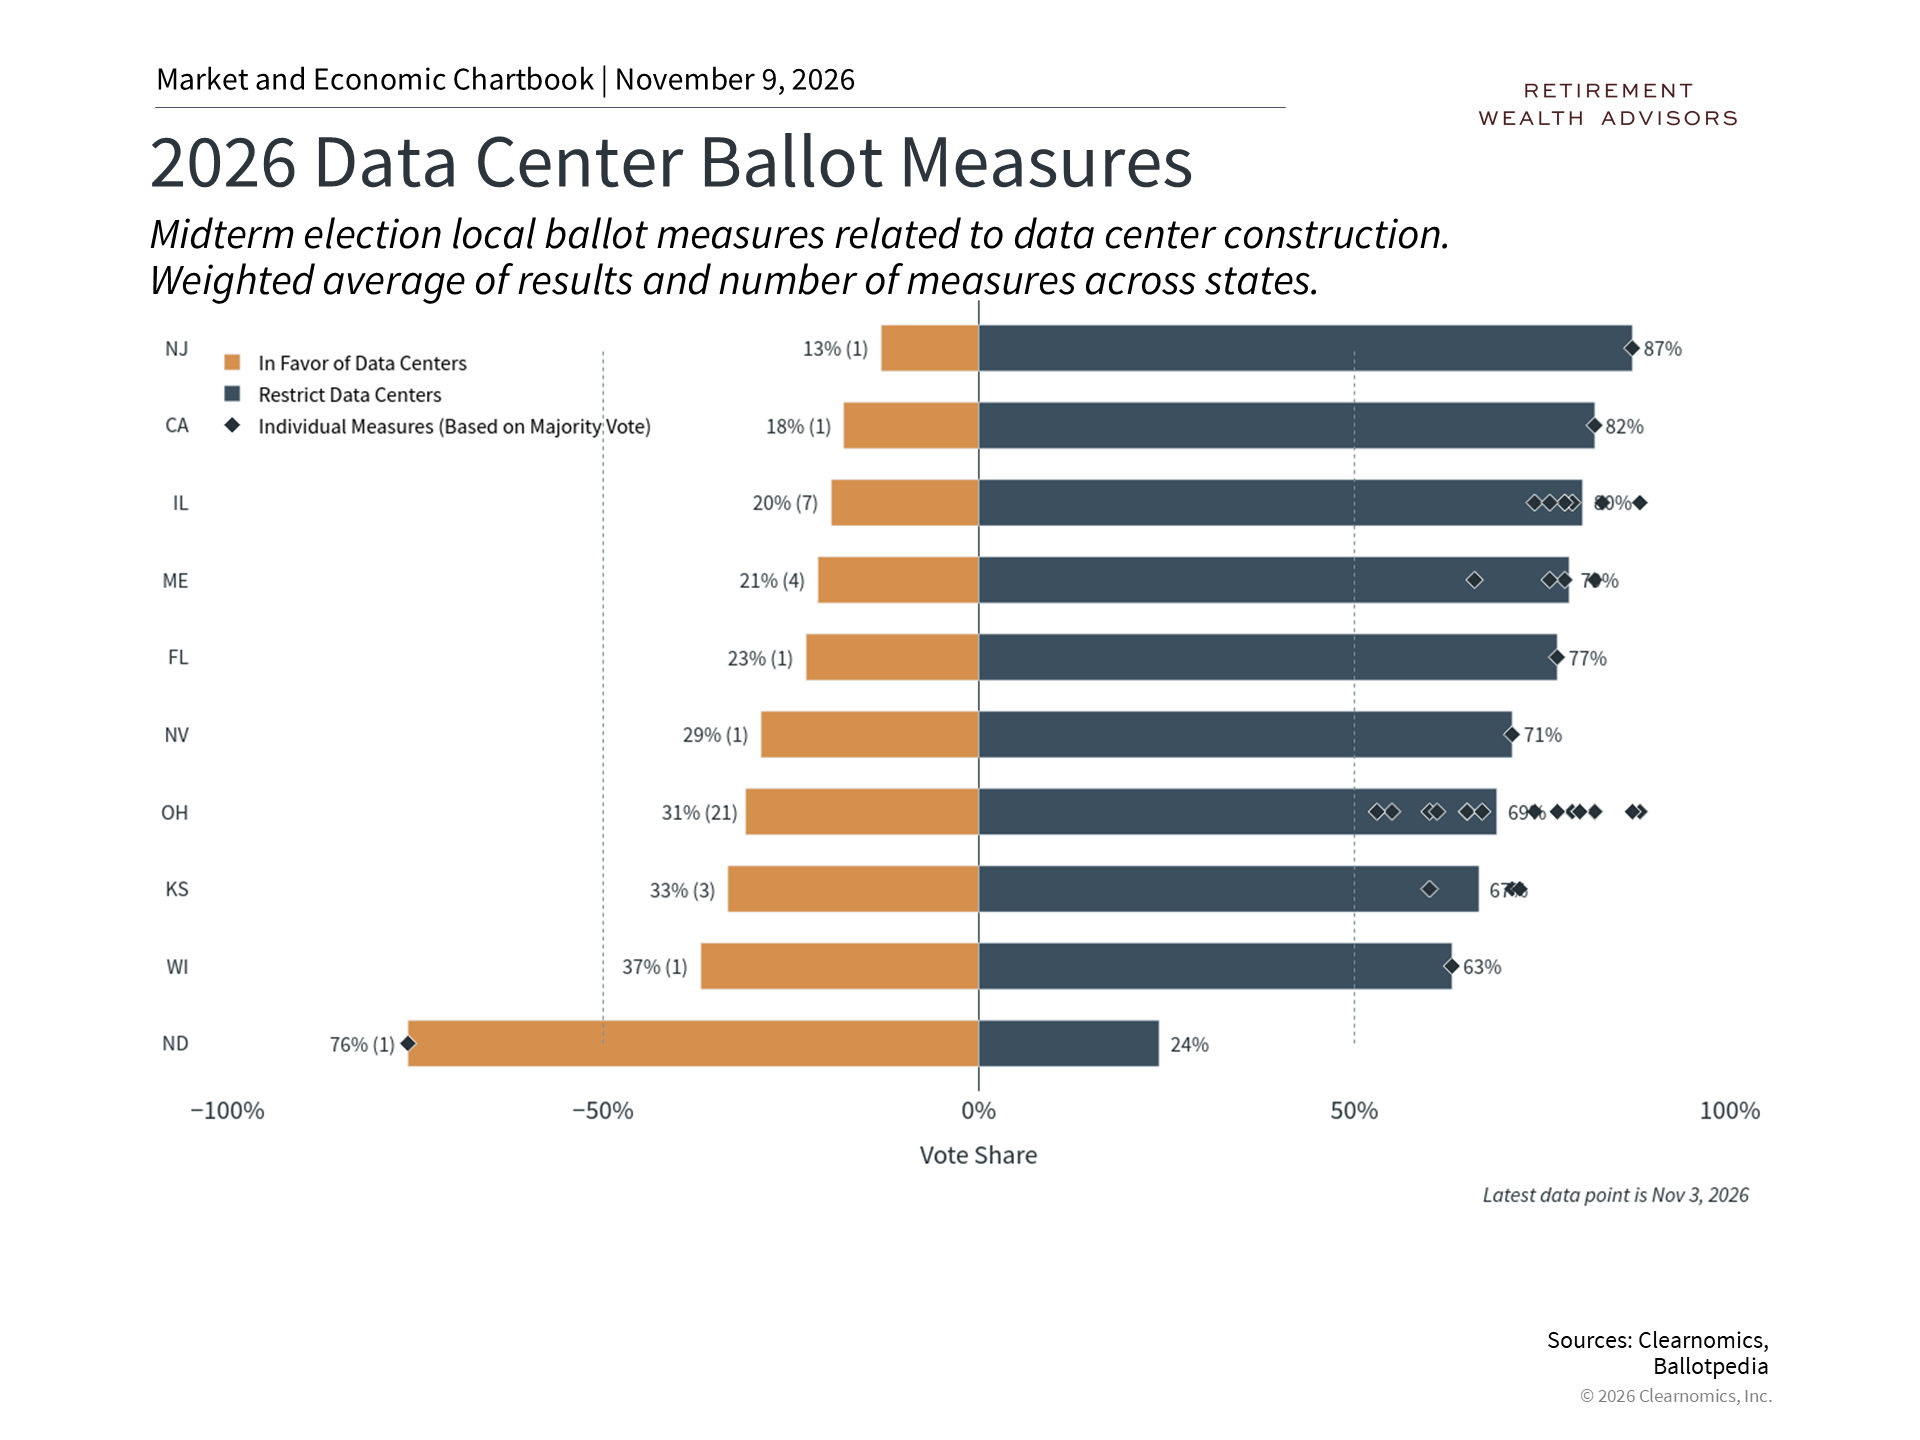
As the chart above shows, opposition to data center construction was common across the country. So far this year, there have been 47 local measures directly related to data centers, with 41 voted on during the midterm election across ten states.1 The results show that voters supported restrictions on data center construction by large margins, with only one exception.
These measures covered a wide range of issues, including zoning rules, electricity and water use, and regulations specific to data centers. For example, one measure in Kansas banned "high-impact" data centers, defined as facilities using more than 10 megawatts of electricity or 100,000 gallons of water per day, for 10 years. Towns in New Hampshire and Maine approved temporary pauses on new construction.
The one exception was Harwood, North Dakota, a town of roughly 850 people, where about three-quarters of voters rejected stricter review requirements on large industrial projects. This clears the way for construction to continue on a $3 billion data center campus. Voters there reasoned that a data center would likely have been built nearby regardless. By allowing it within town limits, the community could benefit from tax revenues and other economic gains.
The tension between large construction projects and the concerns of local communities is not new, but it is growing faster because of the rapidly increasing demands of AI applications.
Historical parallels include oil and gas drilling sites, which communities have long debated by weighing environmental and quality-of-life concerns against jobs and tax revenues. The same "Not In My Backyard" (NIMBY) dynamic also applies to highways, power plants, cell phone towers, and more. Data centers are the latest example of a large industrial buildout affecting neighborhoods, raising concerns about power usage, water consumption, and the sheer scale of these facilities.
Another comparison is the construction of large factories, which many towns historically competed to attract. In the 19th and 20th centuries, manufacturing plants and mills were not just central to local economies, but entire towns were built around them. While these facilities often brought jobs, tax revenues, and local investment, history shows that depending too heavily on a single industry can create problems over time, alongside concerns about the environment, noise, and strain on local services.
Data centers follow a similar pattern, with one important difference: they typically require a lot of investment and equipment (capital intensive), but do not necessarily create many ongoing jobs (labor intensive). The fact that data centers may not be a major long-term source of local employment appears to be an important reason why so many communities have pushed back, as the ballot results show.
Data center construction has supported the economy
Why have data centers become such a focus? It helps to understand what they actually are. When you visit a website, use a search engine, send an email, shop online, or chat with an AI model, those actions are handled by servers. A data center is essentially a very large warehouse filled with servers, and can cover anywhere from a few dozen to 1,000 acres. These servers run continuously and require electricity, cooling, security, and more. They form the physical backbone that supports all digital services, which are increasingly driven by AI.
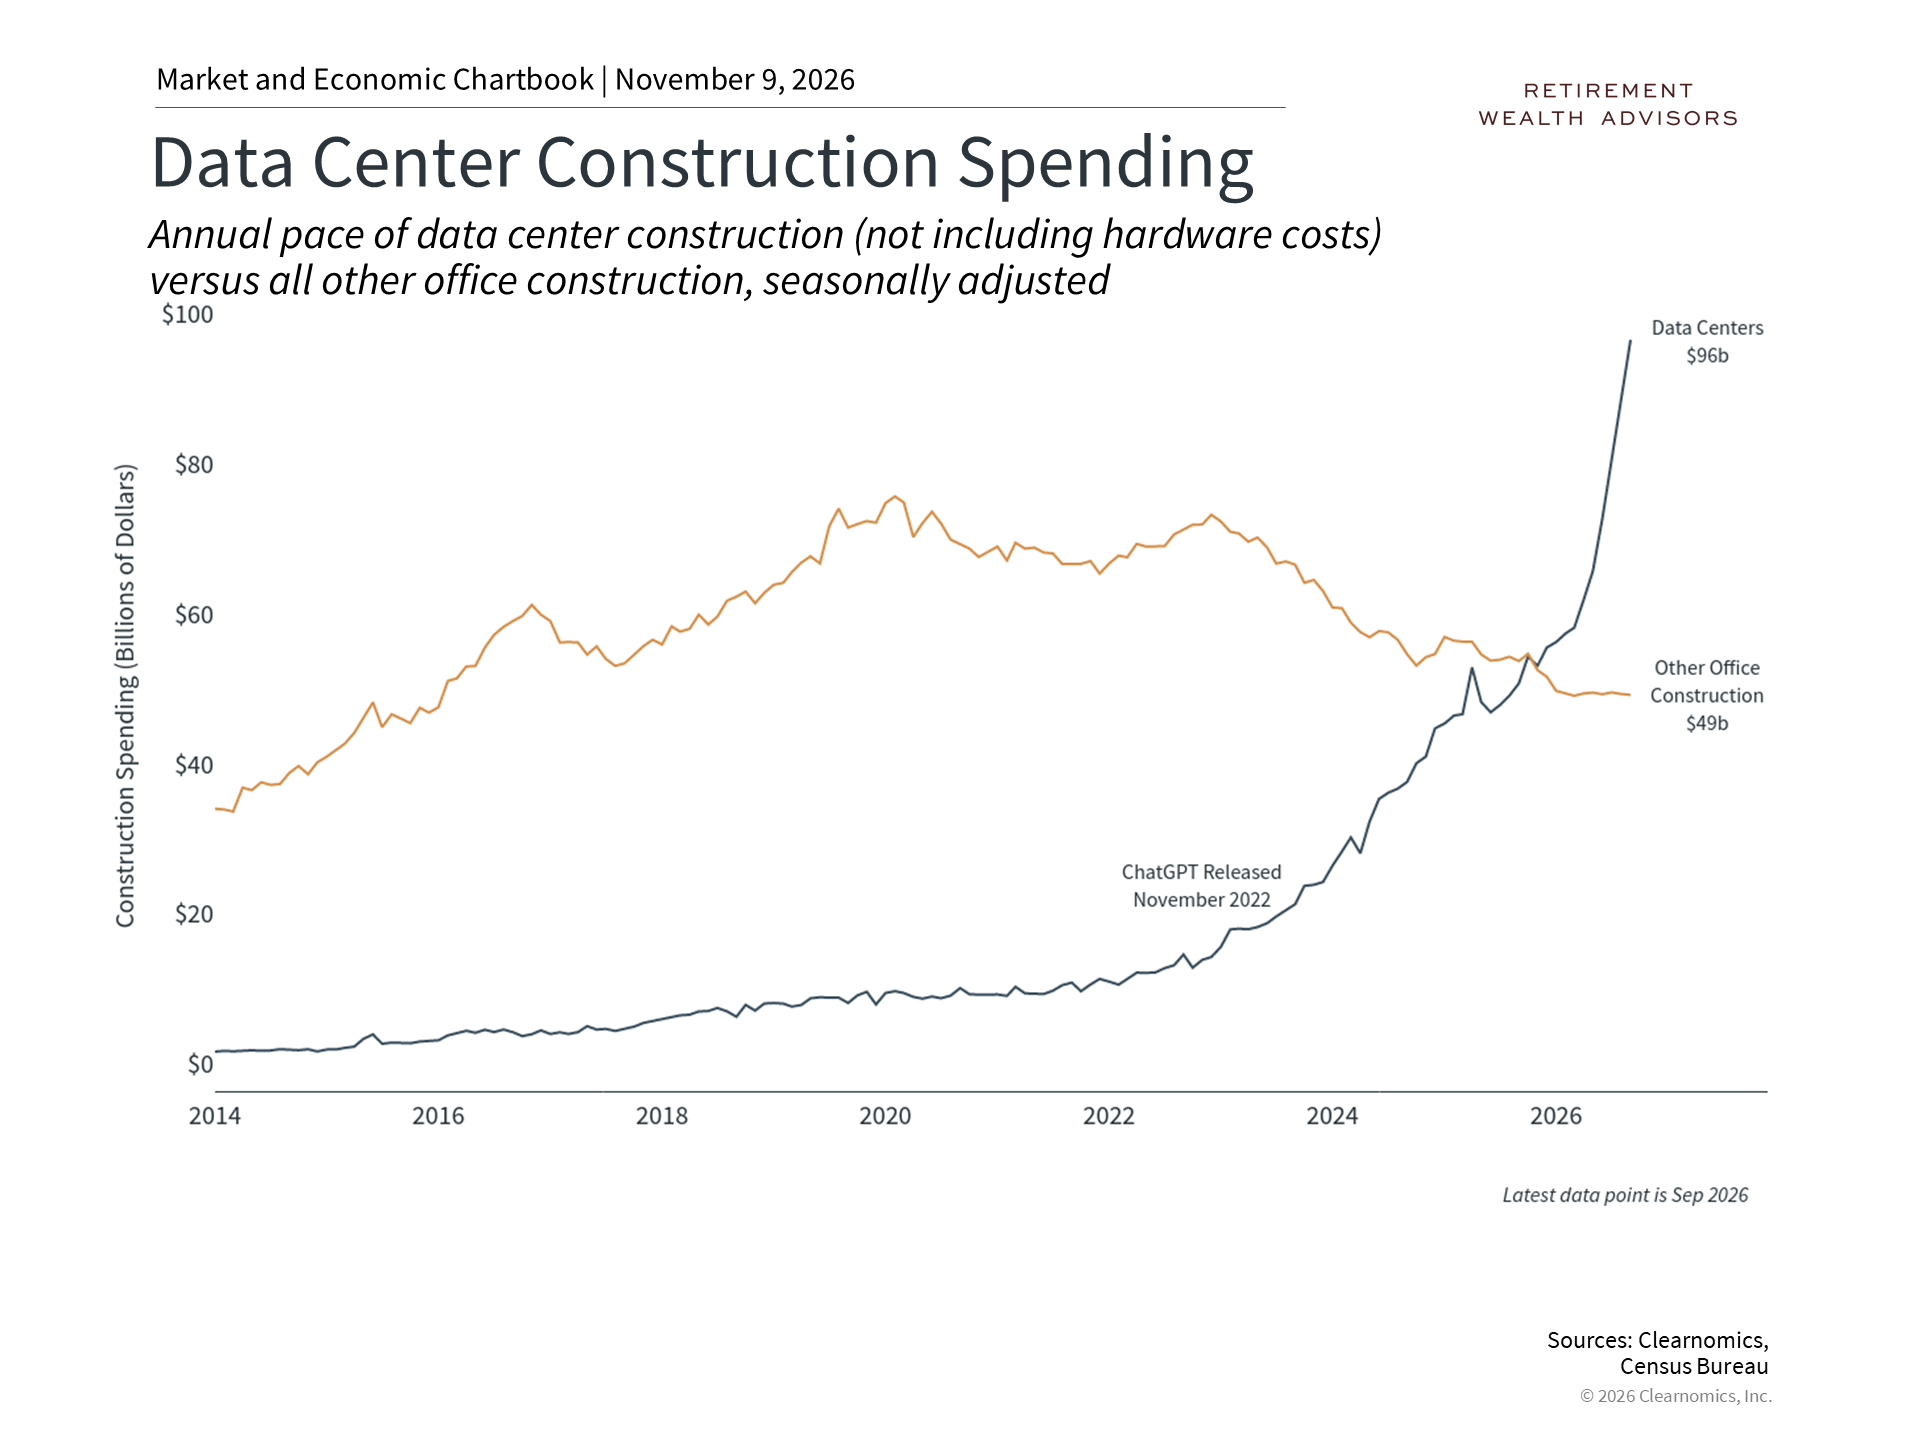
Spending on these facilities has grown significantly as a share of overall economic activity. As the chart above shows, spending on data center construction (not including the equipment inside) rose sharply after the launch of ChatGPT in late 2022. The Census Bureau estimates it has reached $96 billion on an annualized basis, well above the roughly $49 billion spent on all other office construction.2 This buildout is one reason that gross private domestic investment, which measures business spending on buildings, equipment, and related items, and is a component of Gross Domestic Product (GDP), accelerated to 3.3% in the third quarter, according to the Bureau of Economic Analysis.3
It is important to separate the potential long-term benefits of AI, such as productivity gains, better profit margins, and new business models, from what is currently moving markets. Right now, it is the physical construction of AI infrastructure that is driving economic activity and financial markets.
This is similar to the railroad boom of the 19th century, where building rail lines created jobs and demand for materials like steel. That was separate from the longer-term economic benefits that faster transportation eventually delivered. Restrictions on data centers may slow the pace of construction, but the real question for the long term is whether AI applications will truly boost productivity and deliver real economic benefits.
Technology and AI stocks can be volatile
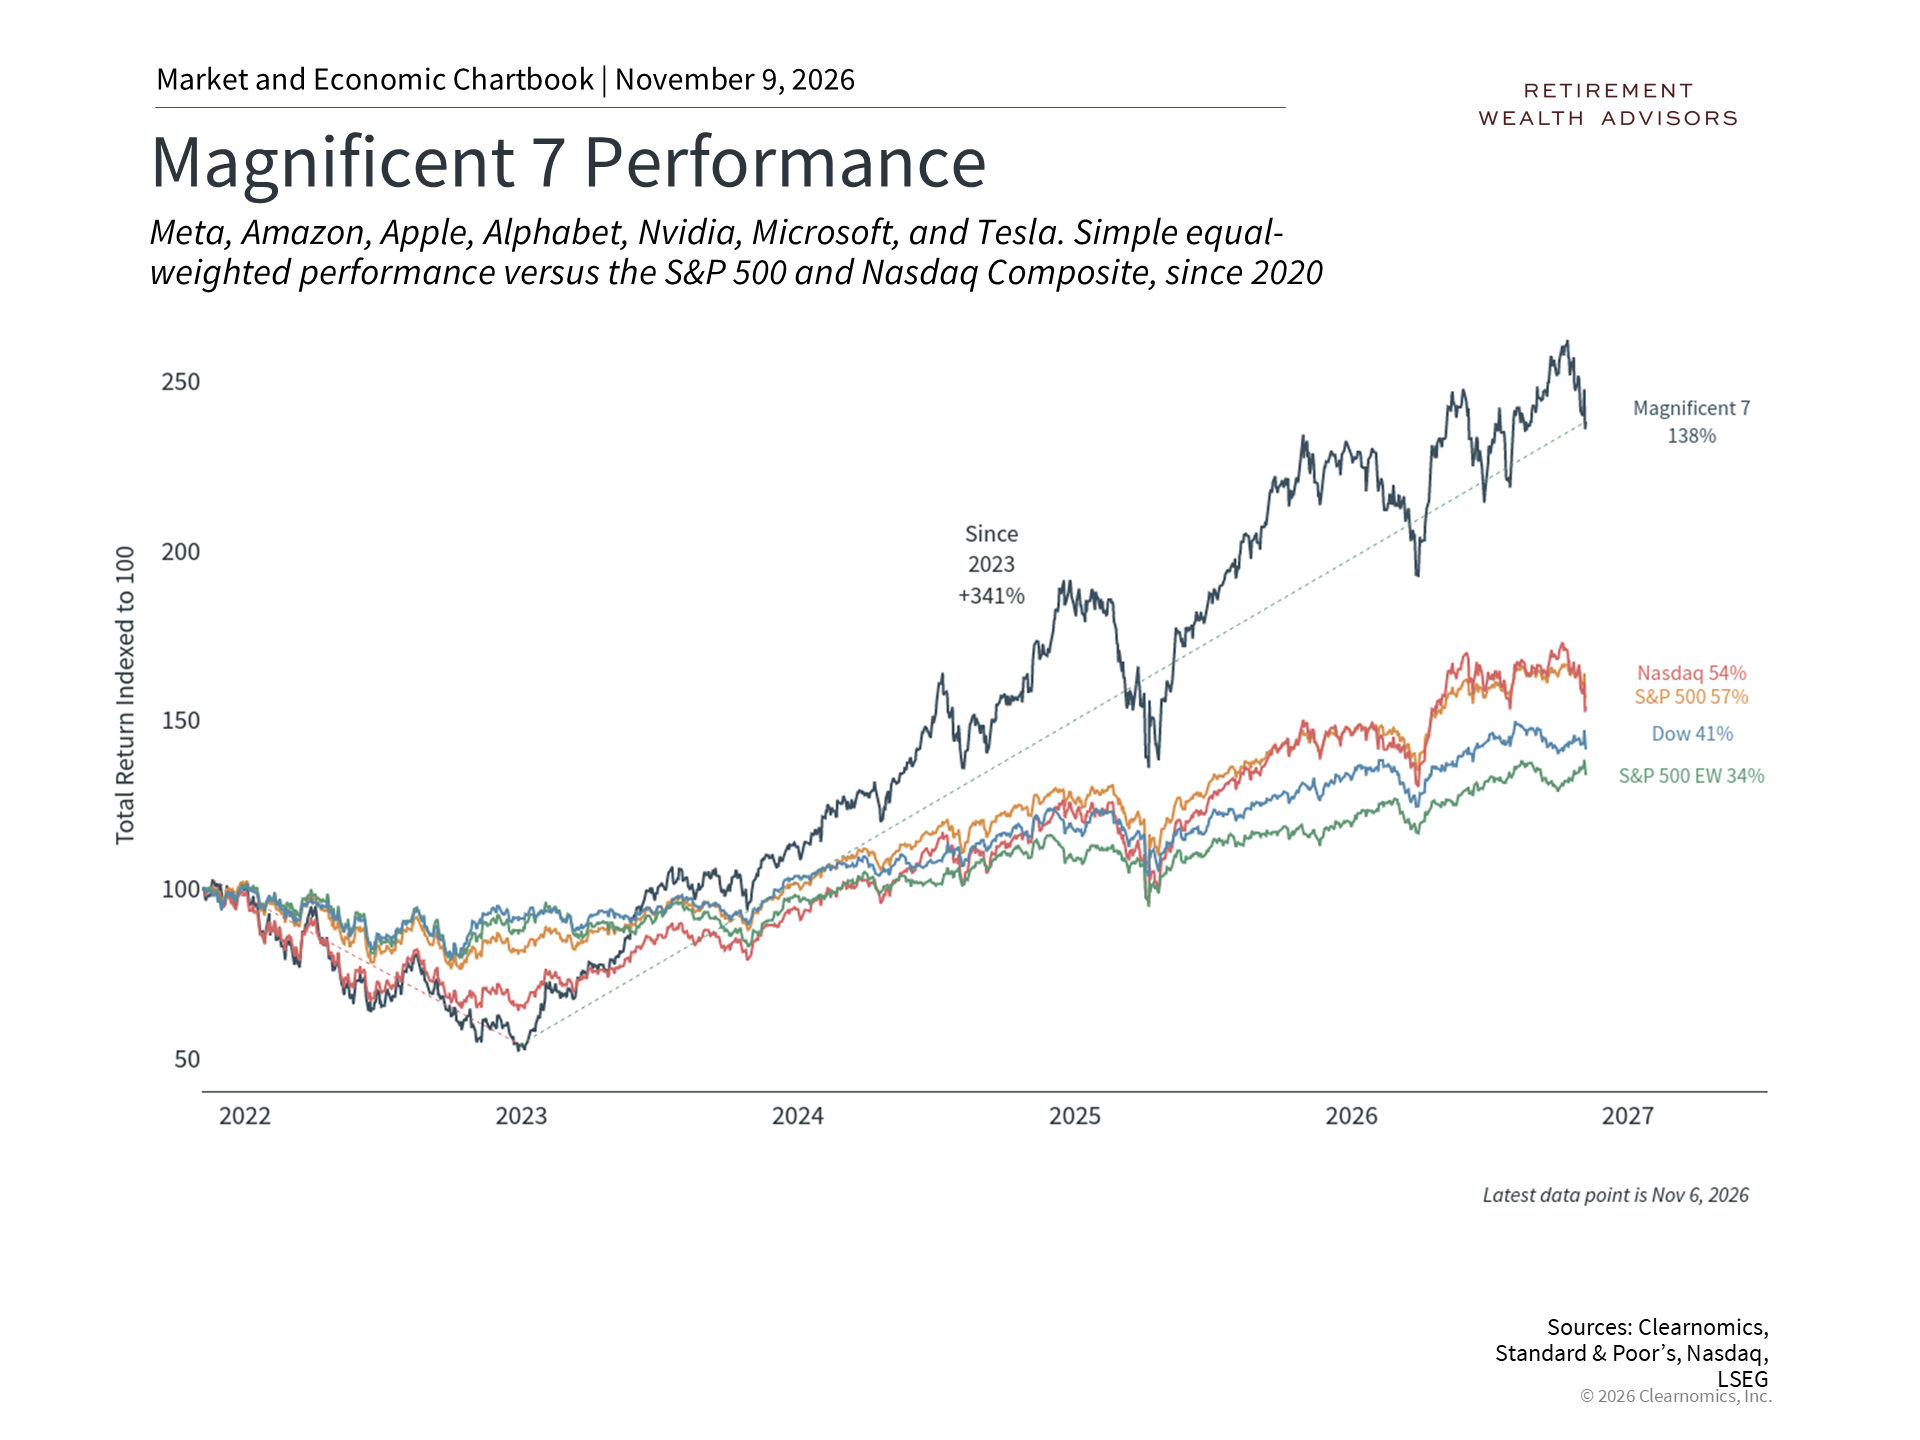
As the chart illustrates, the Magnificent 7 group of technology stocks, which includes Meta, Amazon, Apple, Alphabet, Nvidia, Microsoft, and Tesla, has delivered strong returns over the past several years. These stocks have gained around 140% since 2022 and rose about 340% from the start of 2023 to their recent peak, outpacing both the S&P 500 and the Nasdaq.4 However, the chart also shows significant drops along the way, including during the current period of volatility.
Not all AI-related companies have reacted the same way. Semiconductor makers and so-called "neoclouds," which are newer publicly traded companies that provide cloud computing services, saw sharper declines in the days after the election. By contrast, large "hyperscalers," the companies that are funding the AI buildout, did not experience as large a drop, though they have also faced pressure due to concerns about their cash flows.
Pullbacks like these are not unusual, even for companies with strong long-term fundamentals. In 2022, when interest rates rose rapidly, the Magnificent 7 declined by nearly 50% before recovering and going on to deliver healthy returns for long-term investors. More broadly, major new technologies have often faced public and regulatory resistance during their early buildout phases.
Of course, today's volatility also reflects genuine uncertainty. It is not yet clear whether new restrictions will be widespread and lasting, or whether economic incentives will eventually lead more communities to support data center development. For investors, this is a reminder that AI is not a single investment but a long-term theme that can support portfolios over time.
The bottom line? The midterm election has raised new questions about the pace of data center construction across the country. However, recent volatility is not unusual, and maintaining a long-term perspective with a well-balanced portfolio remains the best way to navigate these periods.
References
1. Clearnomics research using Ballotpedia data, as of November 3, 2026
2. Clearnomics research using Census Bureau data, as of November 6, 2026
3. https://www.bea.gov/news/2026/gdp-advance-estimate-3rd-quarter-2026
4. Clearnomics research using Standard and Poor's, Nasdaq, and LSEG data, as of November 6, 2026
Index Descriptions
S&P 500
The Standard & Poor's 500 Index is a capitalization-weighted index of 500 stocks designed to measure performance of the broad domestic economy through changes in the aggregate market value of 500 stocks representing all major industries.
Dow Jones
The Dow Jones Industrial Average consists of 30 stocks that are major factors in their industries and widely held by individuals and institutional investors.
NASDAQ
The NASDAQ Composite Index measures all NASDAQ domestic and non-U.S. based common stocks listed on The NASDAQ Stock Market. The market value, the last sale price multiplied by total shares outstanding, is calculated throughout the trading day, and is related to the total value of the Index.
