
The technology sector and AI-related stocks have been a major focus for investors, so it is important to understand what is behind this correction while also keeping everything in perspective.
A steep run, then a sharp pullback
The Nasdaq Composite Index, which is concentrated in technology stocks, recently fell into correction territory after a decline of 12% from its all-time high, which was reached only a month earlier. The decline on Thursday, November 5, two days after the midterm election, was the worst single-day drop for the more concentrated Nasdaq-100 since 2020. This was driven by semiconductor companies, chipmakers, and the so-called neoclouds, which are newer public companies that provide cloud computing services.
What triggered the latest swing
The key trigger of this short-term volatility was the midterm election result. That includes the shift to Democratic control of Congress, which is viewed as a challenge for ongoing data center construction. Voters in Texas, Ohio, Georgia, and other states backed new restrictions on new data center development. The midterm election raises questions about the pace of the AI infrastructure buildout of the past few years, which has supported economic activity and corporate profits.
Even before the midterm election, more defensive parts of the market had been supporting portfolios. Rising interest rates, with the 10-year Treasury yield around 5%, had put pressure on tech stocks because their valuations depend on future growth expectations. Concerns about billions of dollars in corporate AI investments, cash flow that has stayed negative at some firms, and competition from open source AI models raised further questions about these trends.
Pullbacks like this are not unusual
It is always important to keep perspective when markets are volatile. These types of pullbacks, while never pleasant, are not unusual for highly sensitive parts of the market such as technology. In 2022, when interest rates rose rapidly, the Magnificent 7 group of technology stocks declined in value by nearly 50%. They then went on to recover and generate healthy returns for long-term investors. This is not to say that history will repeat itself exactly, but market swings are a normal part of investing, and trying to time them can work against you.
For long-term investors, these pullbacks do mean that valuations are more attractive. The irony is that while investors often wish they could invest at better prices, those opportunities occur during periods that feel challenging. Balancing investment behavior with the right time horizon and asset allocation, in order to benefit from more attractive valuations, can be a core driver of long-term investment success.
The broader market has been calmer than the headlines
The overall stock market has been surprisingly calm this year, despite short periods of uncertainty around the war in Iran, the Fed, and other events. The largest intra-year decline for the S&P 500, for instance, has only been about 9%, and there have only been two pullbacks of 5% or worse this year. This is atypical and has occurred because other sectors such as Health Care, Consumer Staples, and Materials have contributed to year-to-date returns.
The chart below showing market cycles for the Nasdaq Composite helps put the latest pullback into perspective. Tech stocks can be volatile over short periods, but they have risen over longer timeframes. History shows that staying invested and maintaining a long-term perspective is still the best way to navigate periods of uncertainty.
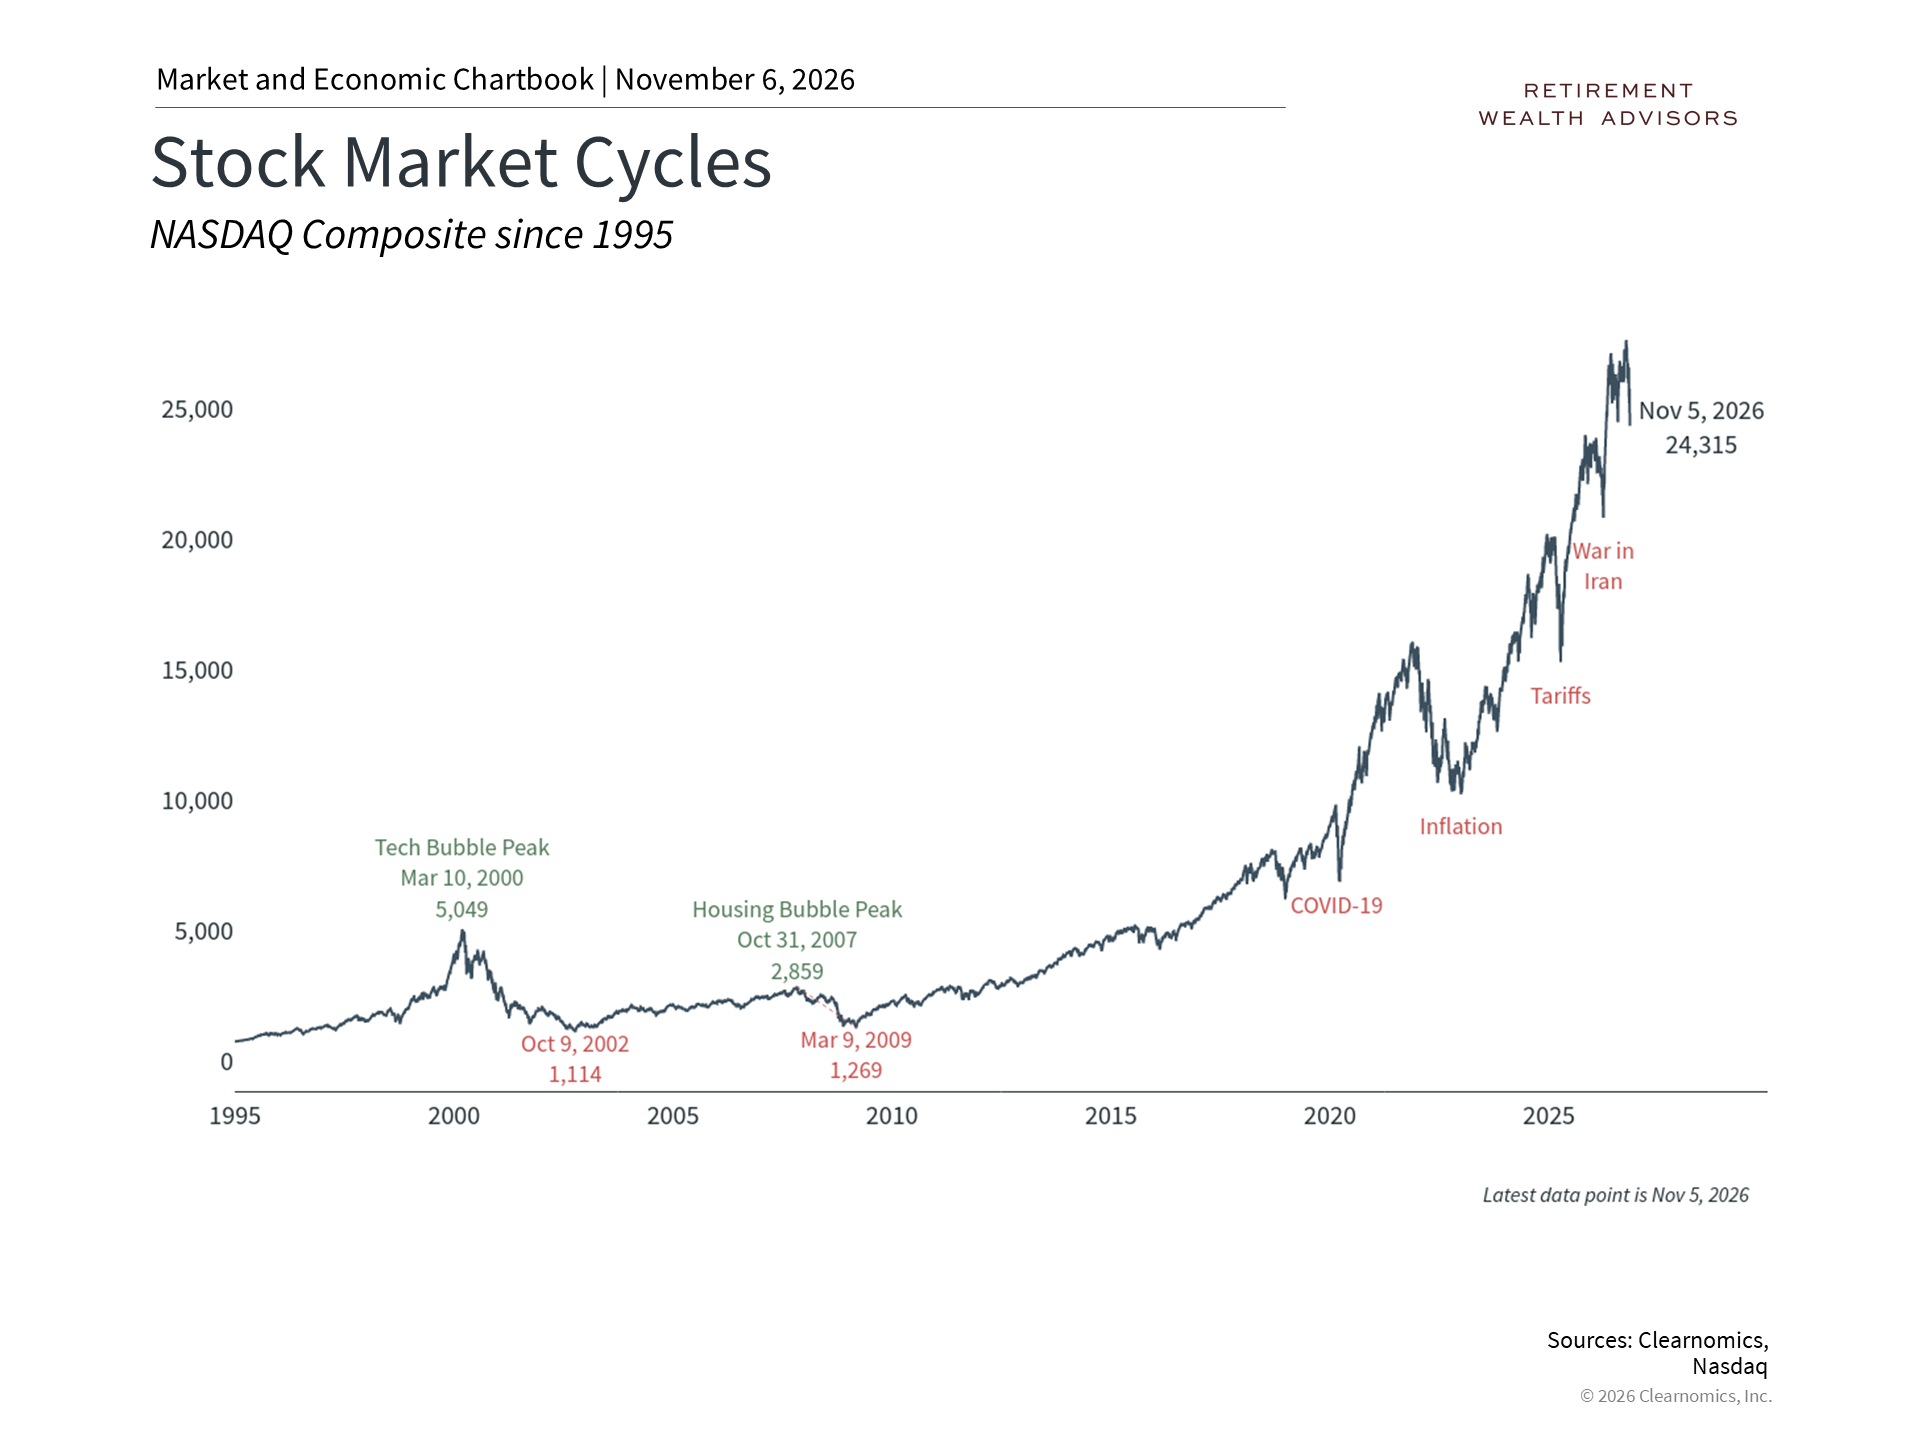
The bottom line? Technology stocks have moved into correction territory after a steep run, driven by the midterm election, higher interest rates, and questions about the AI buildout. For long-term investors, pullbacks of this kind are a normal part of market cycles. Staying focused on a plan and a balanced allocation remains more useful than trying to time each swing.
References
1. Nasdaq as of November 5, 2026
2. Clearnomics research using Nasdaq data, as of November 5, 2026
Index Descriptions
S&P 500
The Standard & Poor's 500 Index is a capitalization-weighted index of 500 stocks designed to measure performance of the broad domestic economy through changes in the aggregate market value of 500 stocks representing all major industries.
NASDAQ
The NASDAQ Composite Index measures all NASDAQ domestic and non-U.S. based common stocks listed on The NASDAQ Stock Market. The market value, the last sale price multiplied by total shares outstanding, is calculated throughout the trading day, and is related to the total value of the Index.
NASDAQ-100
The NASDAQ-100 Index includes 100 of the largest non-financial companies listed on The NASDAQ Stock Market, based on market capitalization.
